Executive Summary
President Joe Biden’s Build Back Better Act (BBBA) was the focal point of his election platform, promising large increases across a variety of spending priorities without raising taxes on everyday Americans. Now that Biden has assumed office and Democratic lawmakers have control in Congress, the administration is attempting to fulfill those spending promises. The recent inflation surprise has caused the administration to scale back on spending initiatives – cutting the original agenda from roughly $4 trillion to $2 trillion in new spending – while increasing taxes on the wealthiest households. However, the price tag of the plan is expected to have a negative impact on all households
Key findings of this analysis include that BBBA will:
1. Reduce after-tax income for the median Ohio family by more than $1,864 over 10 years.
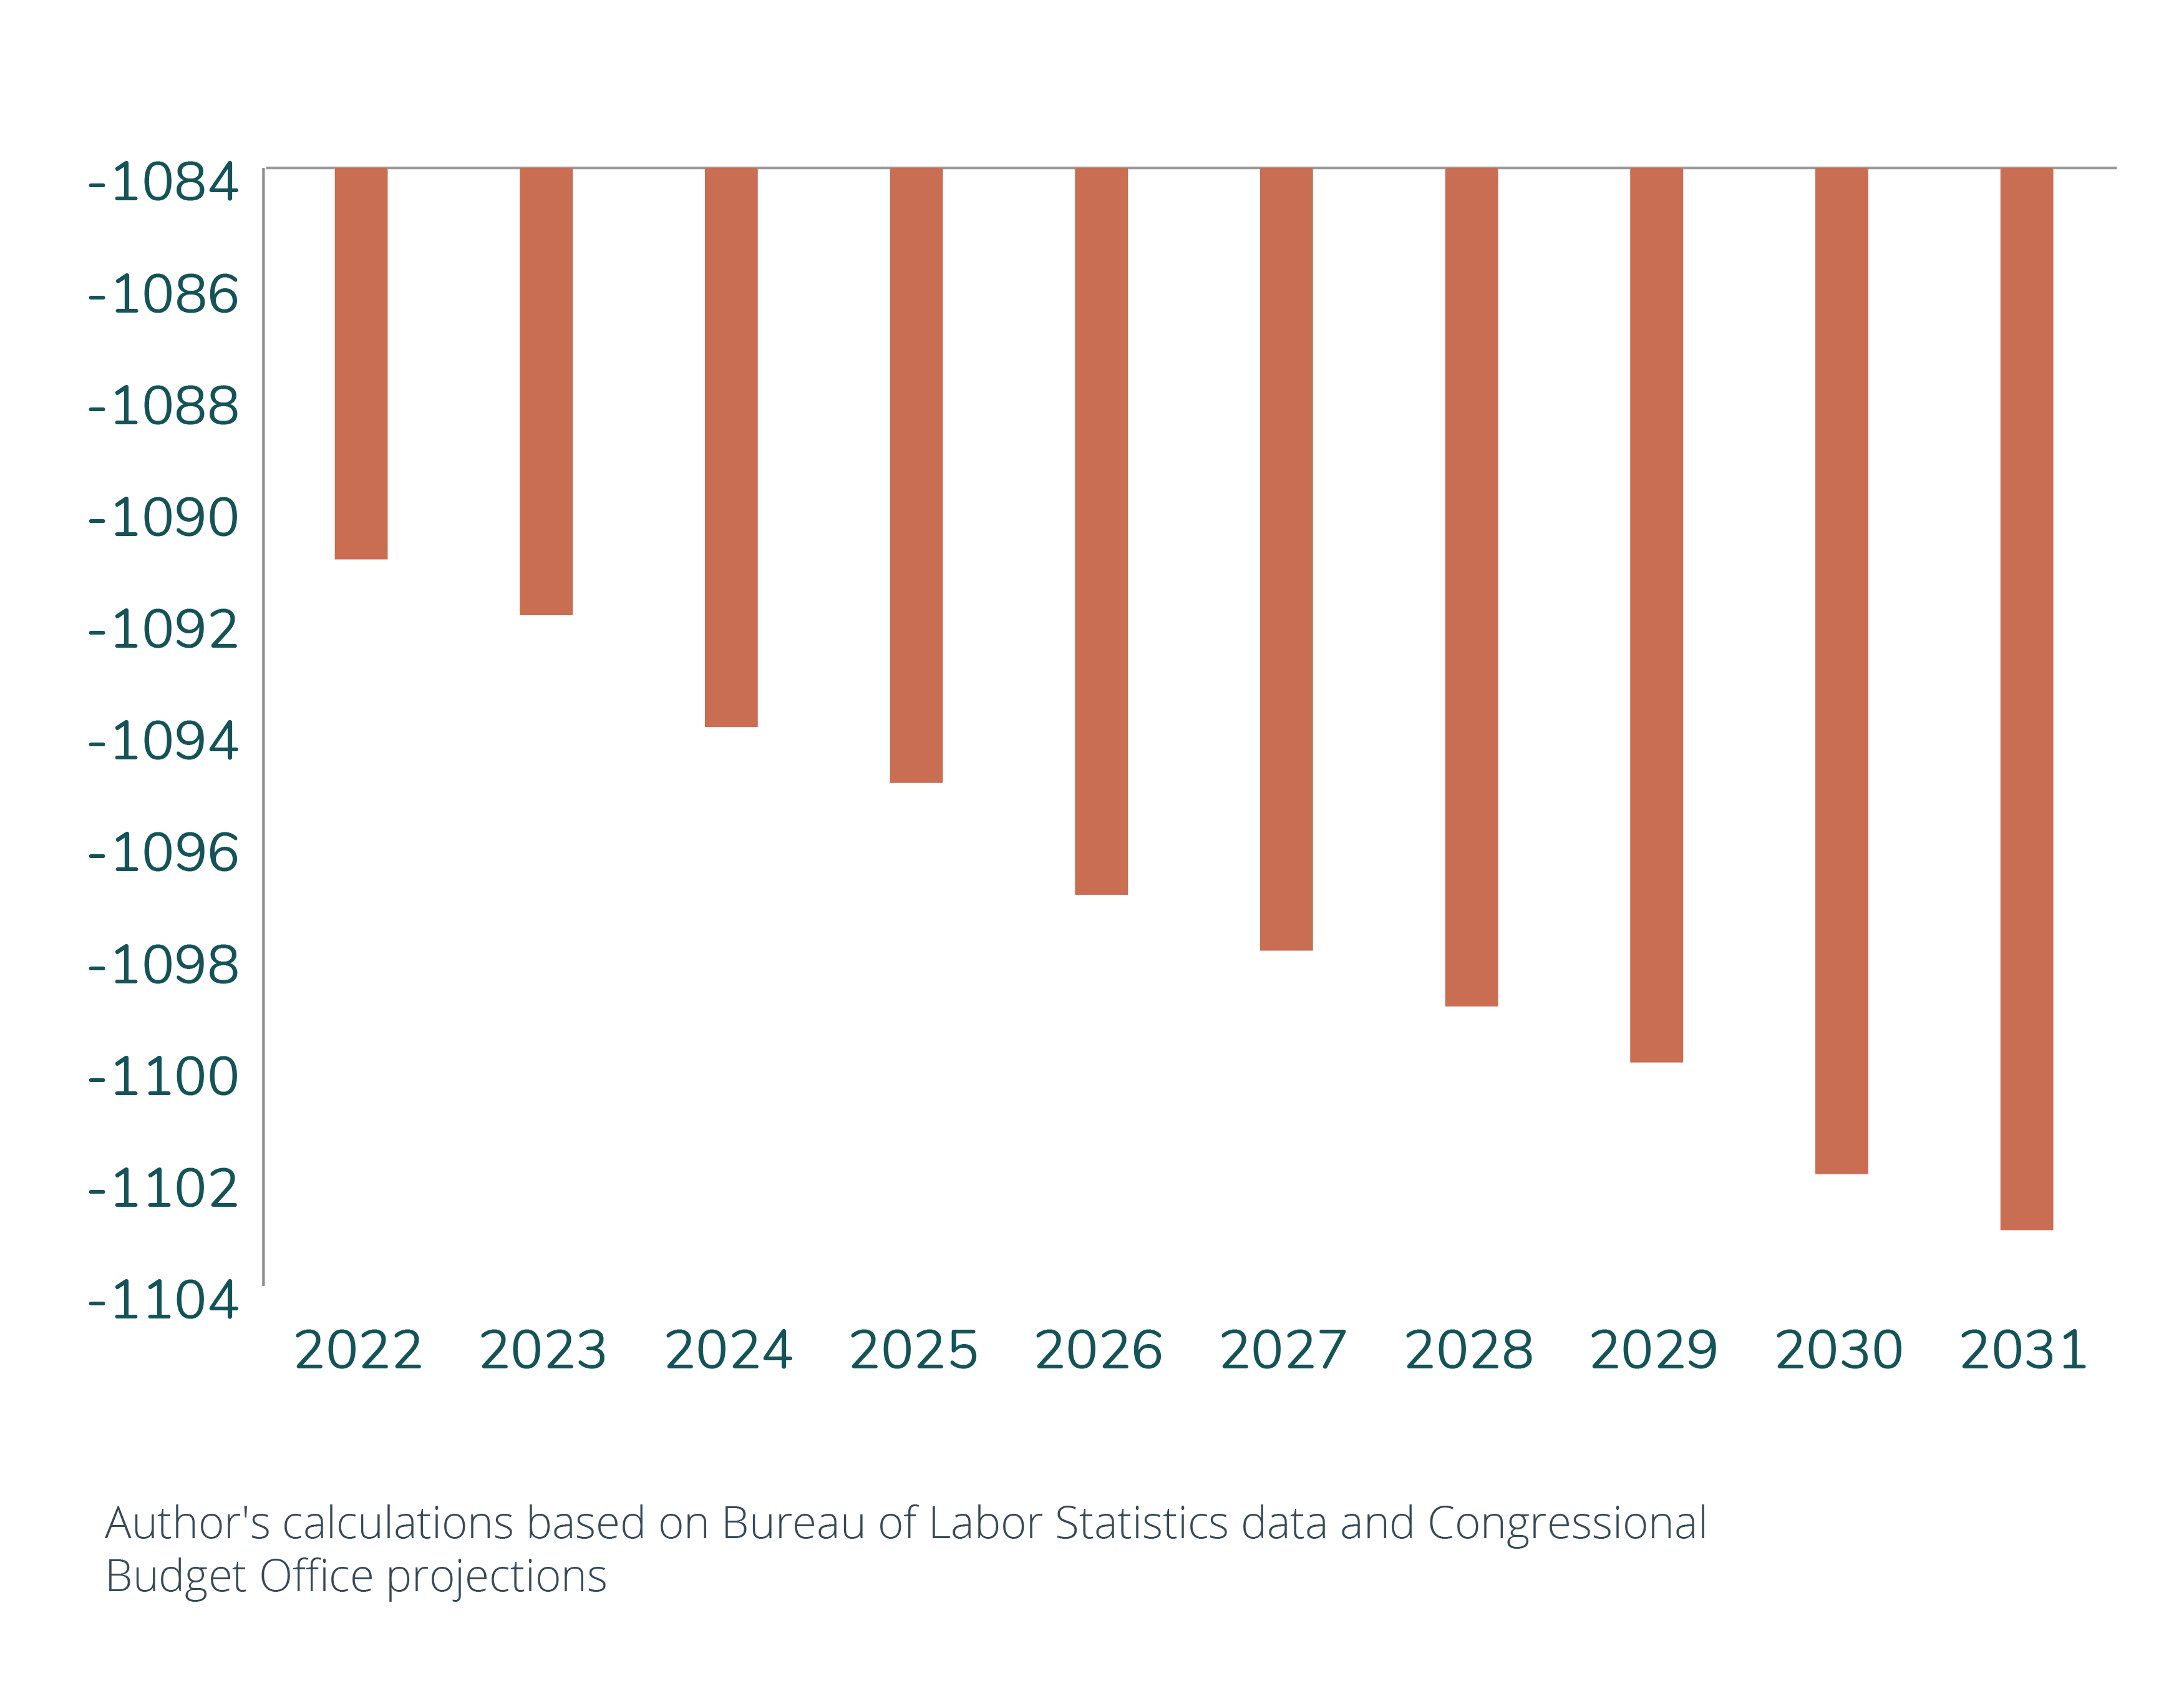
2. Reduce Ohio employment (measured in aggregate hours worked) by 0.02% annually, costing the state the equivalent of 1,091 jobs in 2022, with the negative effect on employment reaching an estimated 1,103 jobs by 2031.
3. Reduce average after-tax incomes for taxpayers across every income quintile in Ohio over the long run.
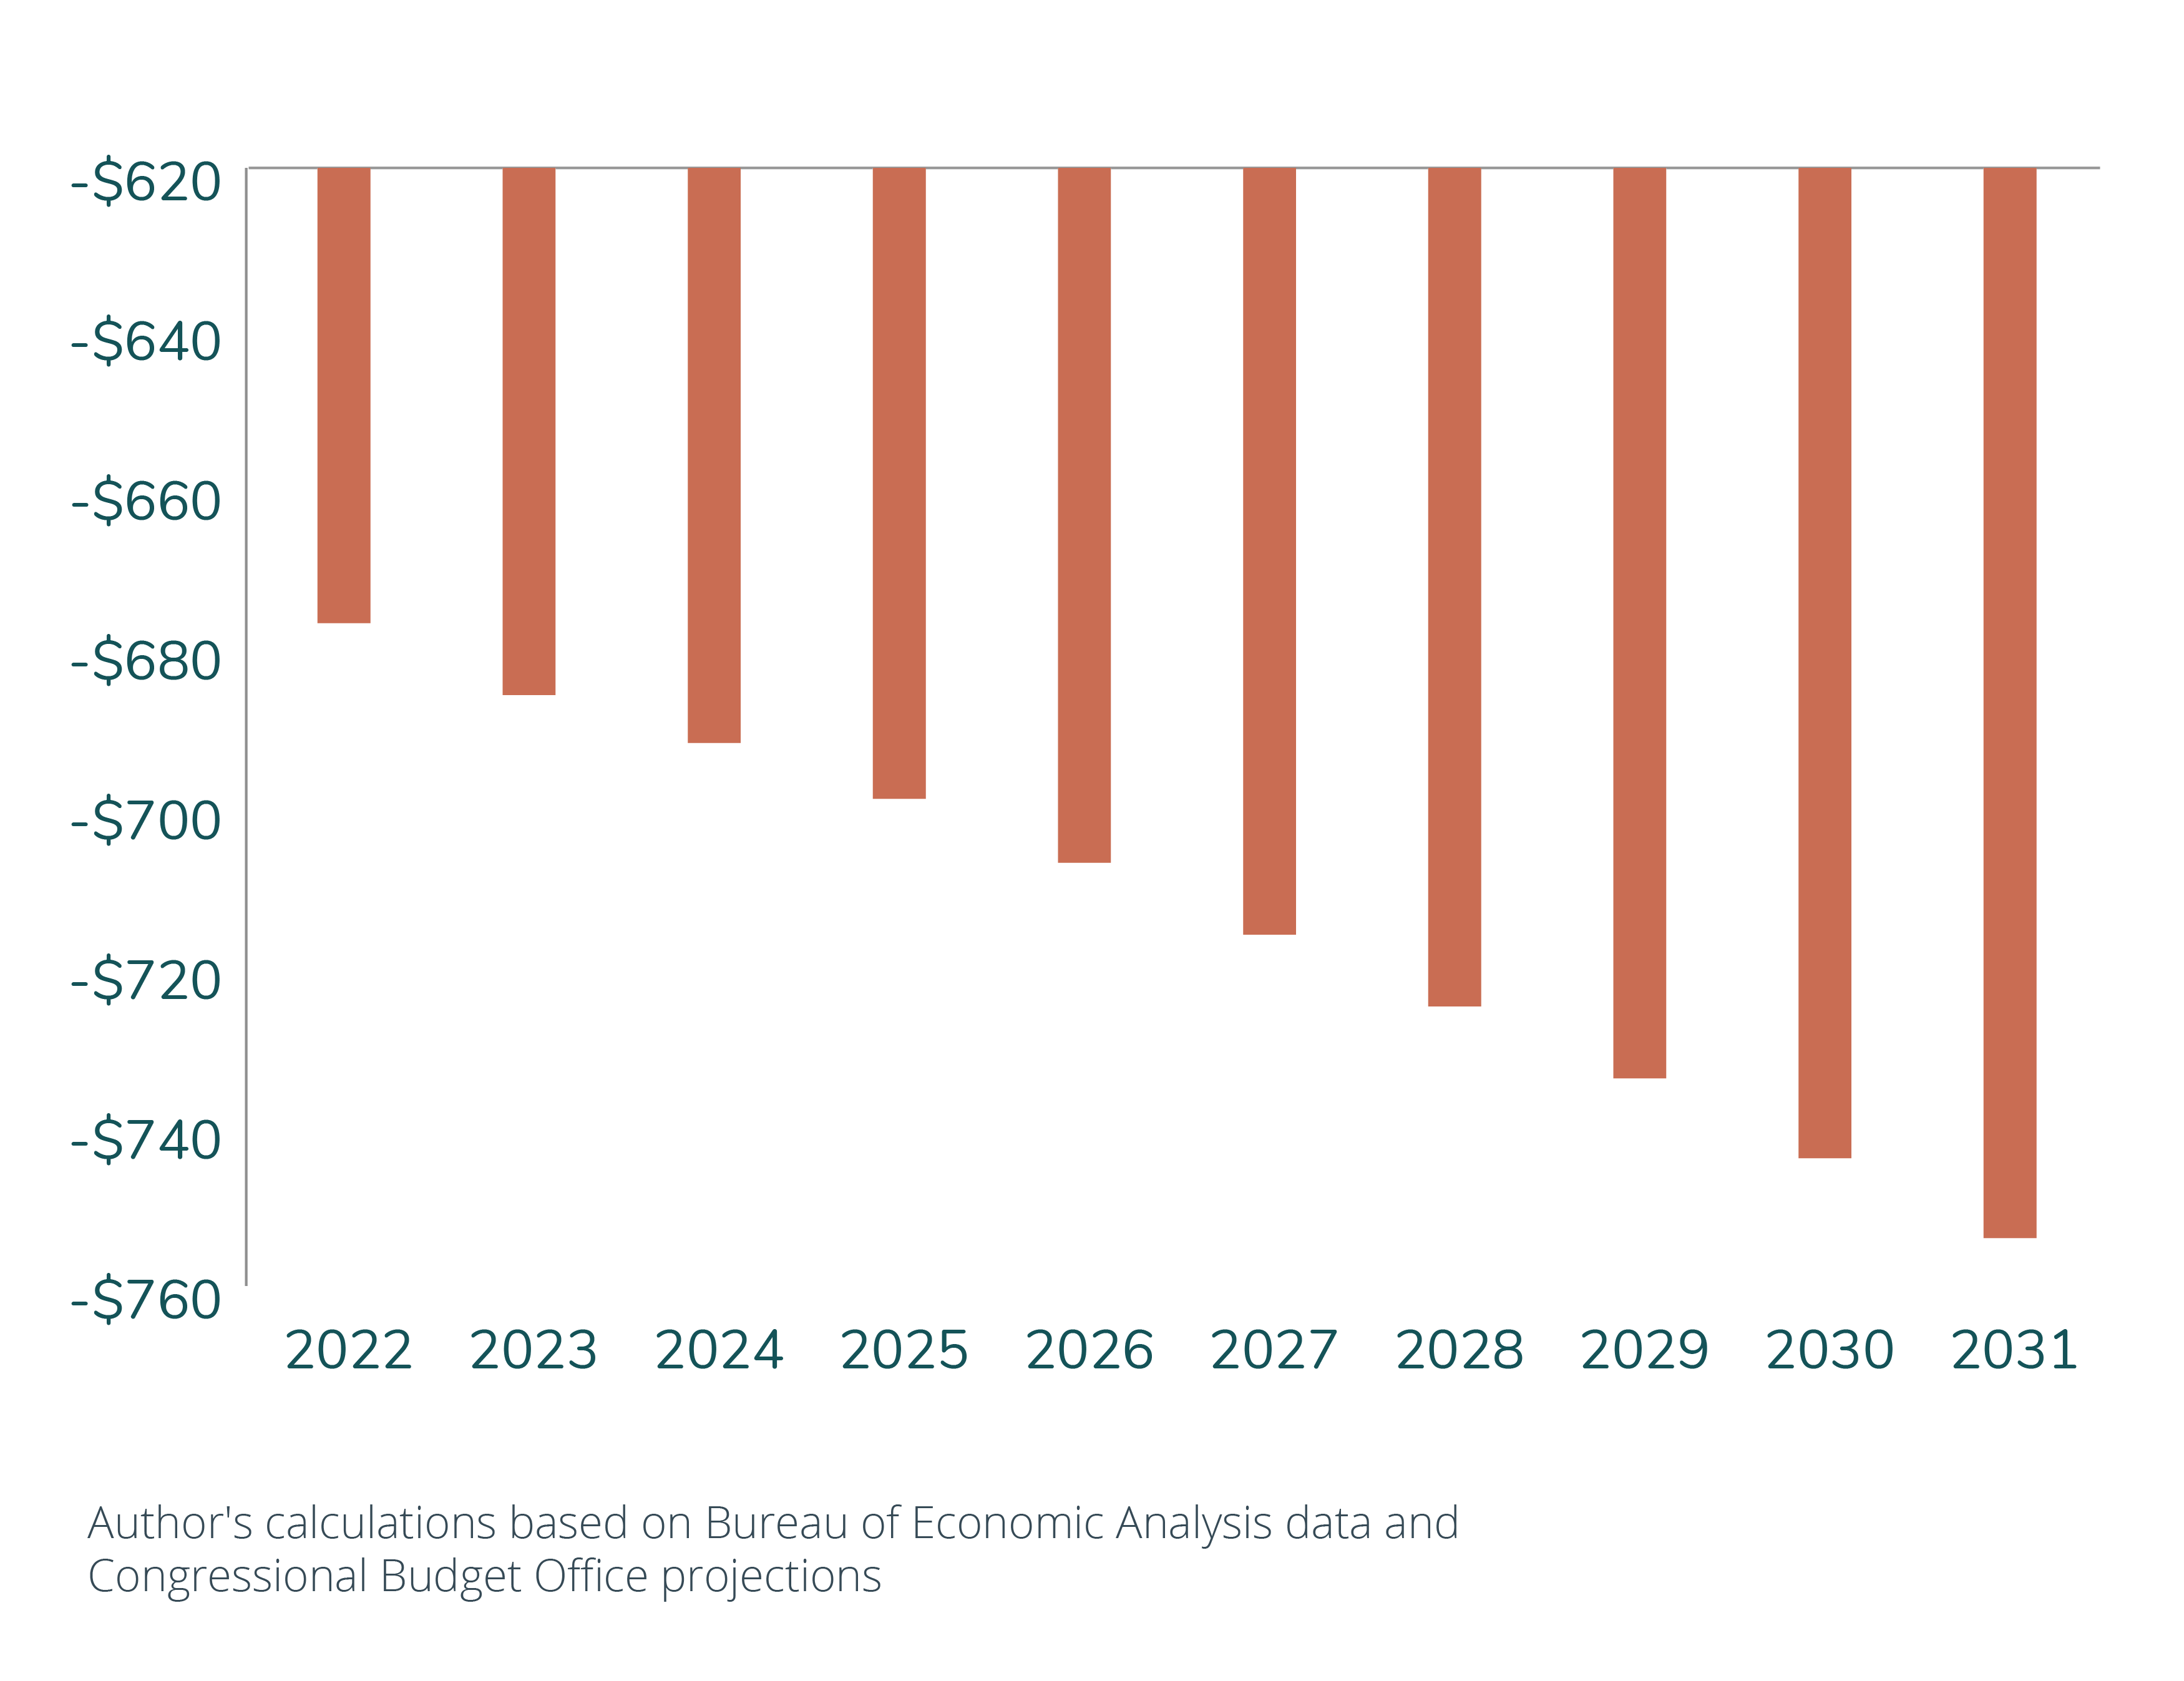
4. Lower the level of real GDP in Ohio by 0.09% in the long run, with GDP down by $677 million in 2022 and nearly $754 million by 2031, compared with expected growth.
This analysis does not model the impact of making permanent the expansion of the Child Tax Credit (CTC). However research shows that the Biden CTC will reduce the labor force participation by 1.5 million working parents in part because it eliminates the work incentives built into the previous version of the tax credit. The policy would exacerbate current labor shortages, push inflation higher and weigh down economic growth.
Introduction
President Biden’s Build Back Better Agenda is now the centerpiece of a new proposal by Democratic lawmakers in the House of Representatives. The administration’s hallmark legislation carries a price tag of roughly $2 trillion according to estimates from the Congressional Budget Office and includes provisions for everything from universal pre-K and child care subsidies to increased Medicaid coverage and $570 billion in spending to combat climate change.
While Democratic leaders hope the massive increase in spending will be appealing enough to voters to retain their majority in the House of Representatives and secure a majority in the Senate, moderate members of the party have expressed concerns over the price tag and provisions within the bill.
Despite claims from the Biden Administration that the plan is fully paid for, the Congressional Budget Office estimates the plan would increase the budget deficit by $367 billion over the next decade despite a slew of new taxes on individuals, businesses and corporations.
Policy changes within the Build Back Better Agenda include a new surcharge on high-income individuals of 5% on Marginally Adjusted Gross Income (MAGI) in excess of $10 million plus 3% on MAGI above $25 million; an increased cap on State and Local Tax Deductions (SALT) that primarily benefits high-income Americans in heavily taxed states; an expansion of the 3.8% Net Investment Income Tax (NIIT) to apply to active business income for pass-through firms, most of which are small businesses; a 15% minimum tax on corporate book income for large corporations and a new 1% excise tax on stock buybacks.
Tax policy can influence economic decisions. On one hand, tax increases reduce the after-tax return to working, saving and investing. On the other hand, a reduction in after-tax income can raise the need to work in order to maintain the same level of well-being. In addition, the increase in federal borrowing can further reduce long-term growth.
Economic Impact
Unfortunately, even though lawmakers have insisted that most Americans will not be facing tax hikes, these changes to the federal tax code are likely to affect all Americans. This is because consumers, workers, shareholders – households – bear the burden of corporate taxes. In addition, the increase in individual income taxes directly raises the tax burden of higher-income Americans
Accounting for behavioral responses of individuals to taxes and new debt (see Appendices) further increases the cost of the plan. The decrease in household income caused by lower corporate earnings reduces what households have available to consume and invest. As a result, the cost of capital increases. New government debt also raises the cost of capital. In addition, because all households are impacted by the slowdown in the buildup of productive capital, they spend less time in paid market activities in favor of activities that aren’t subject to the increased tax burdens. The result is less employment and lower economic growth.
The economic cost to Ohioans:
• A 0.09% decline in long-run GDP, with the inflation-adjusted dollar cost growing from $677 million in 2022 to nearly $754 million by 2031.
• A decrease in employment (measured in hours worked) by 0.2% costing the state the equivalent of 1,091 jobs in 2022, with the negative effect on employment reaching 1,103 by 2031.
• A reduction in after-tax income by for the median Ohio family by more than $1,864 over the next decade.
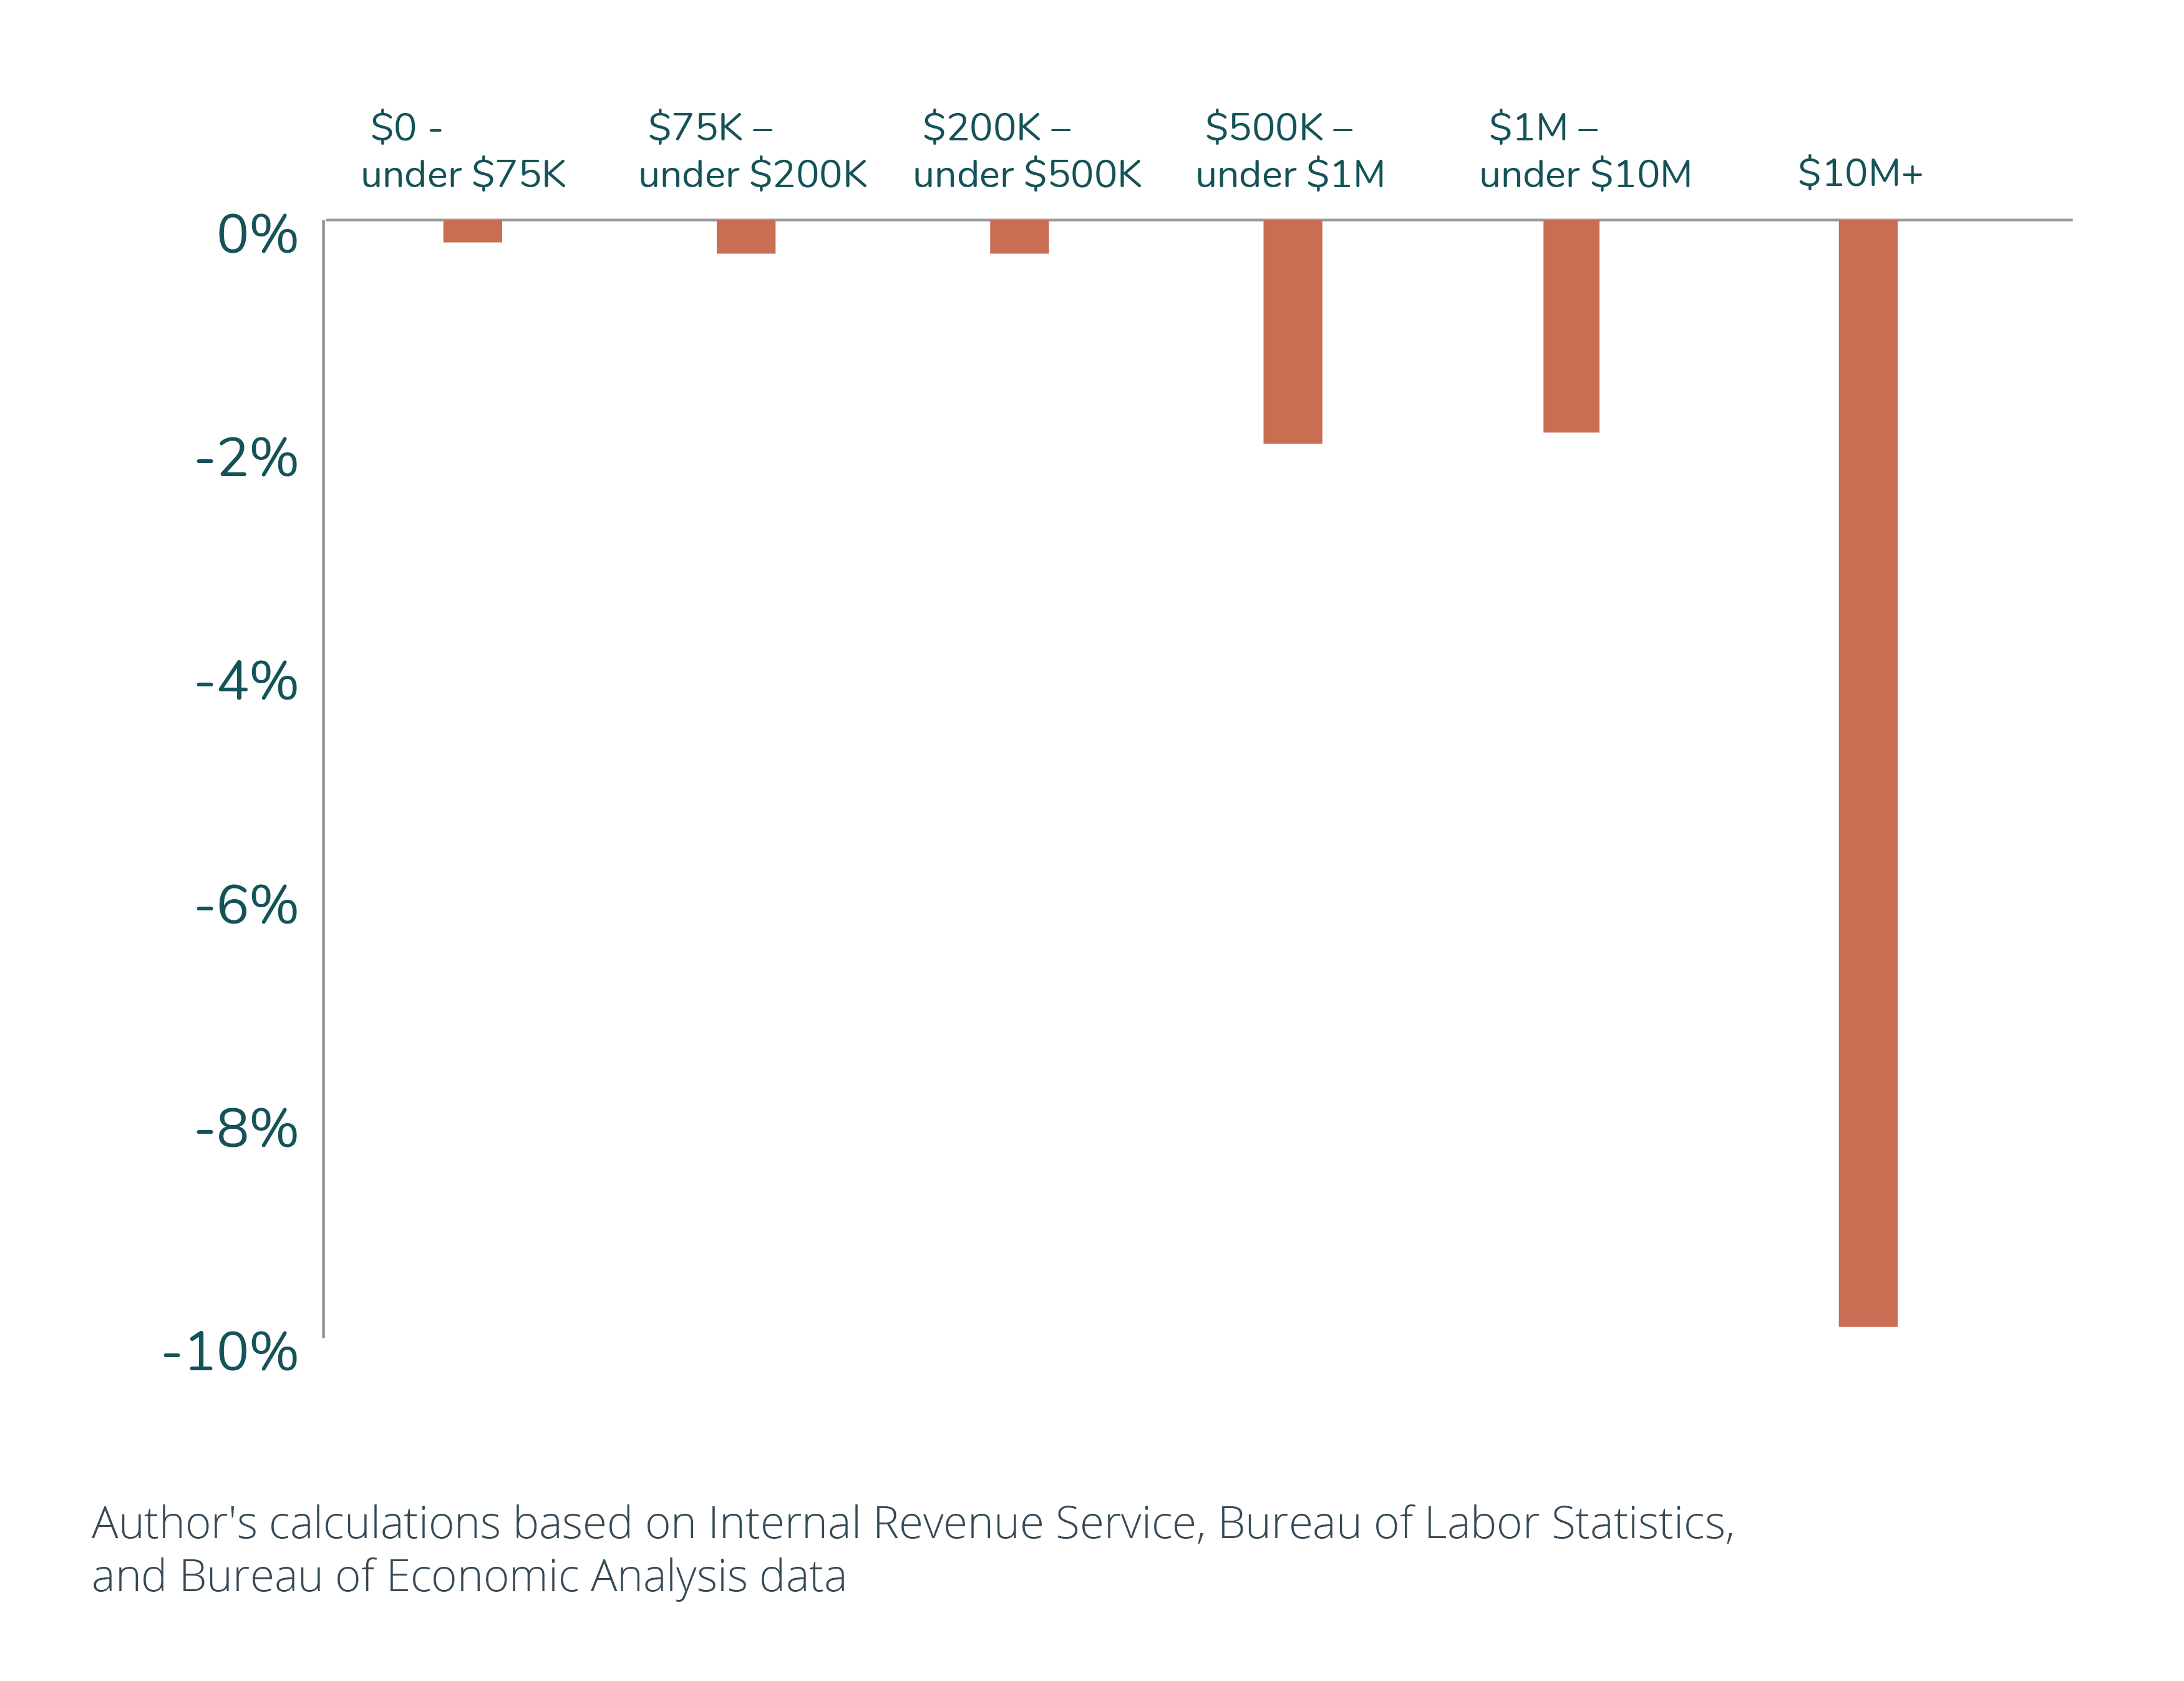
• The biggest losers are mid-career individuals at the peak of their careers, earning $10 million or more. That group is expected to see a roughly 24.5% decrease in their after-tax income
At present, the Ohio economy is projected to grow by nearly 15% over the next decade. However, the tax hikes associated with the Build Back Better Agenda would have reduced this economic growth by an estimated $754 million by 2031.
The negative effects of the taxes in the BBBA would reduce economic growth by $677 million-$754 million annually over the next 10 years relative to pre – BBBA baseline.
The plan would also lower employment. Over the next decade, Ohio is expected to lose out on 1,103 jobs as a result of these changes in the tax code.
The negative effects of the taxes in the BBBA would reduce full-time equivalent jobs by 1,091-1,103 over the next 10 years relative to pre – BBBA baseline.
Individual income and corporate income tax hikes reduce the value of new investments, causing individuals to save and invest less. Because less capital is available for production, labor becomes less productive and wage rates fall. The decrease in productivity and wage rates affect everyone – workers and their employers – not just the millionaires who face higher top marginal tax rates.
The BBBA reduces after-tax income for all Ohioans, despite claims most Americans would face no cost.
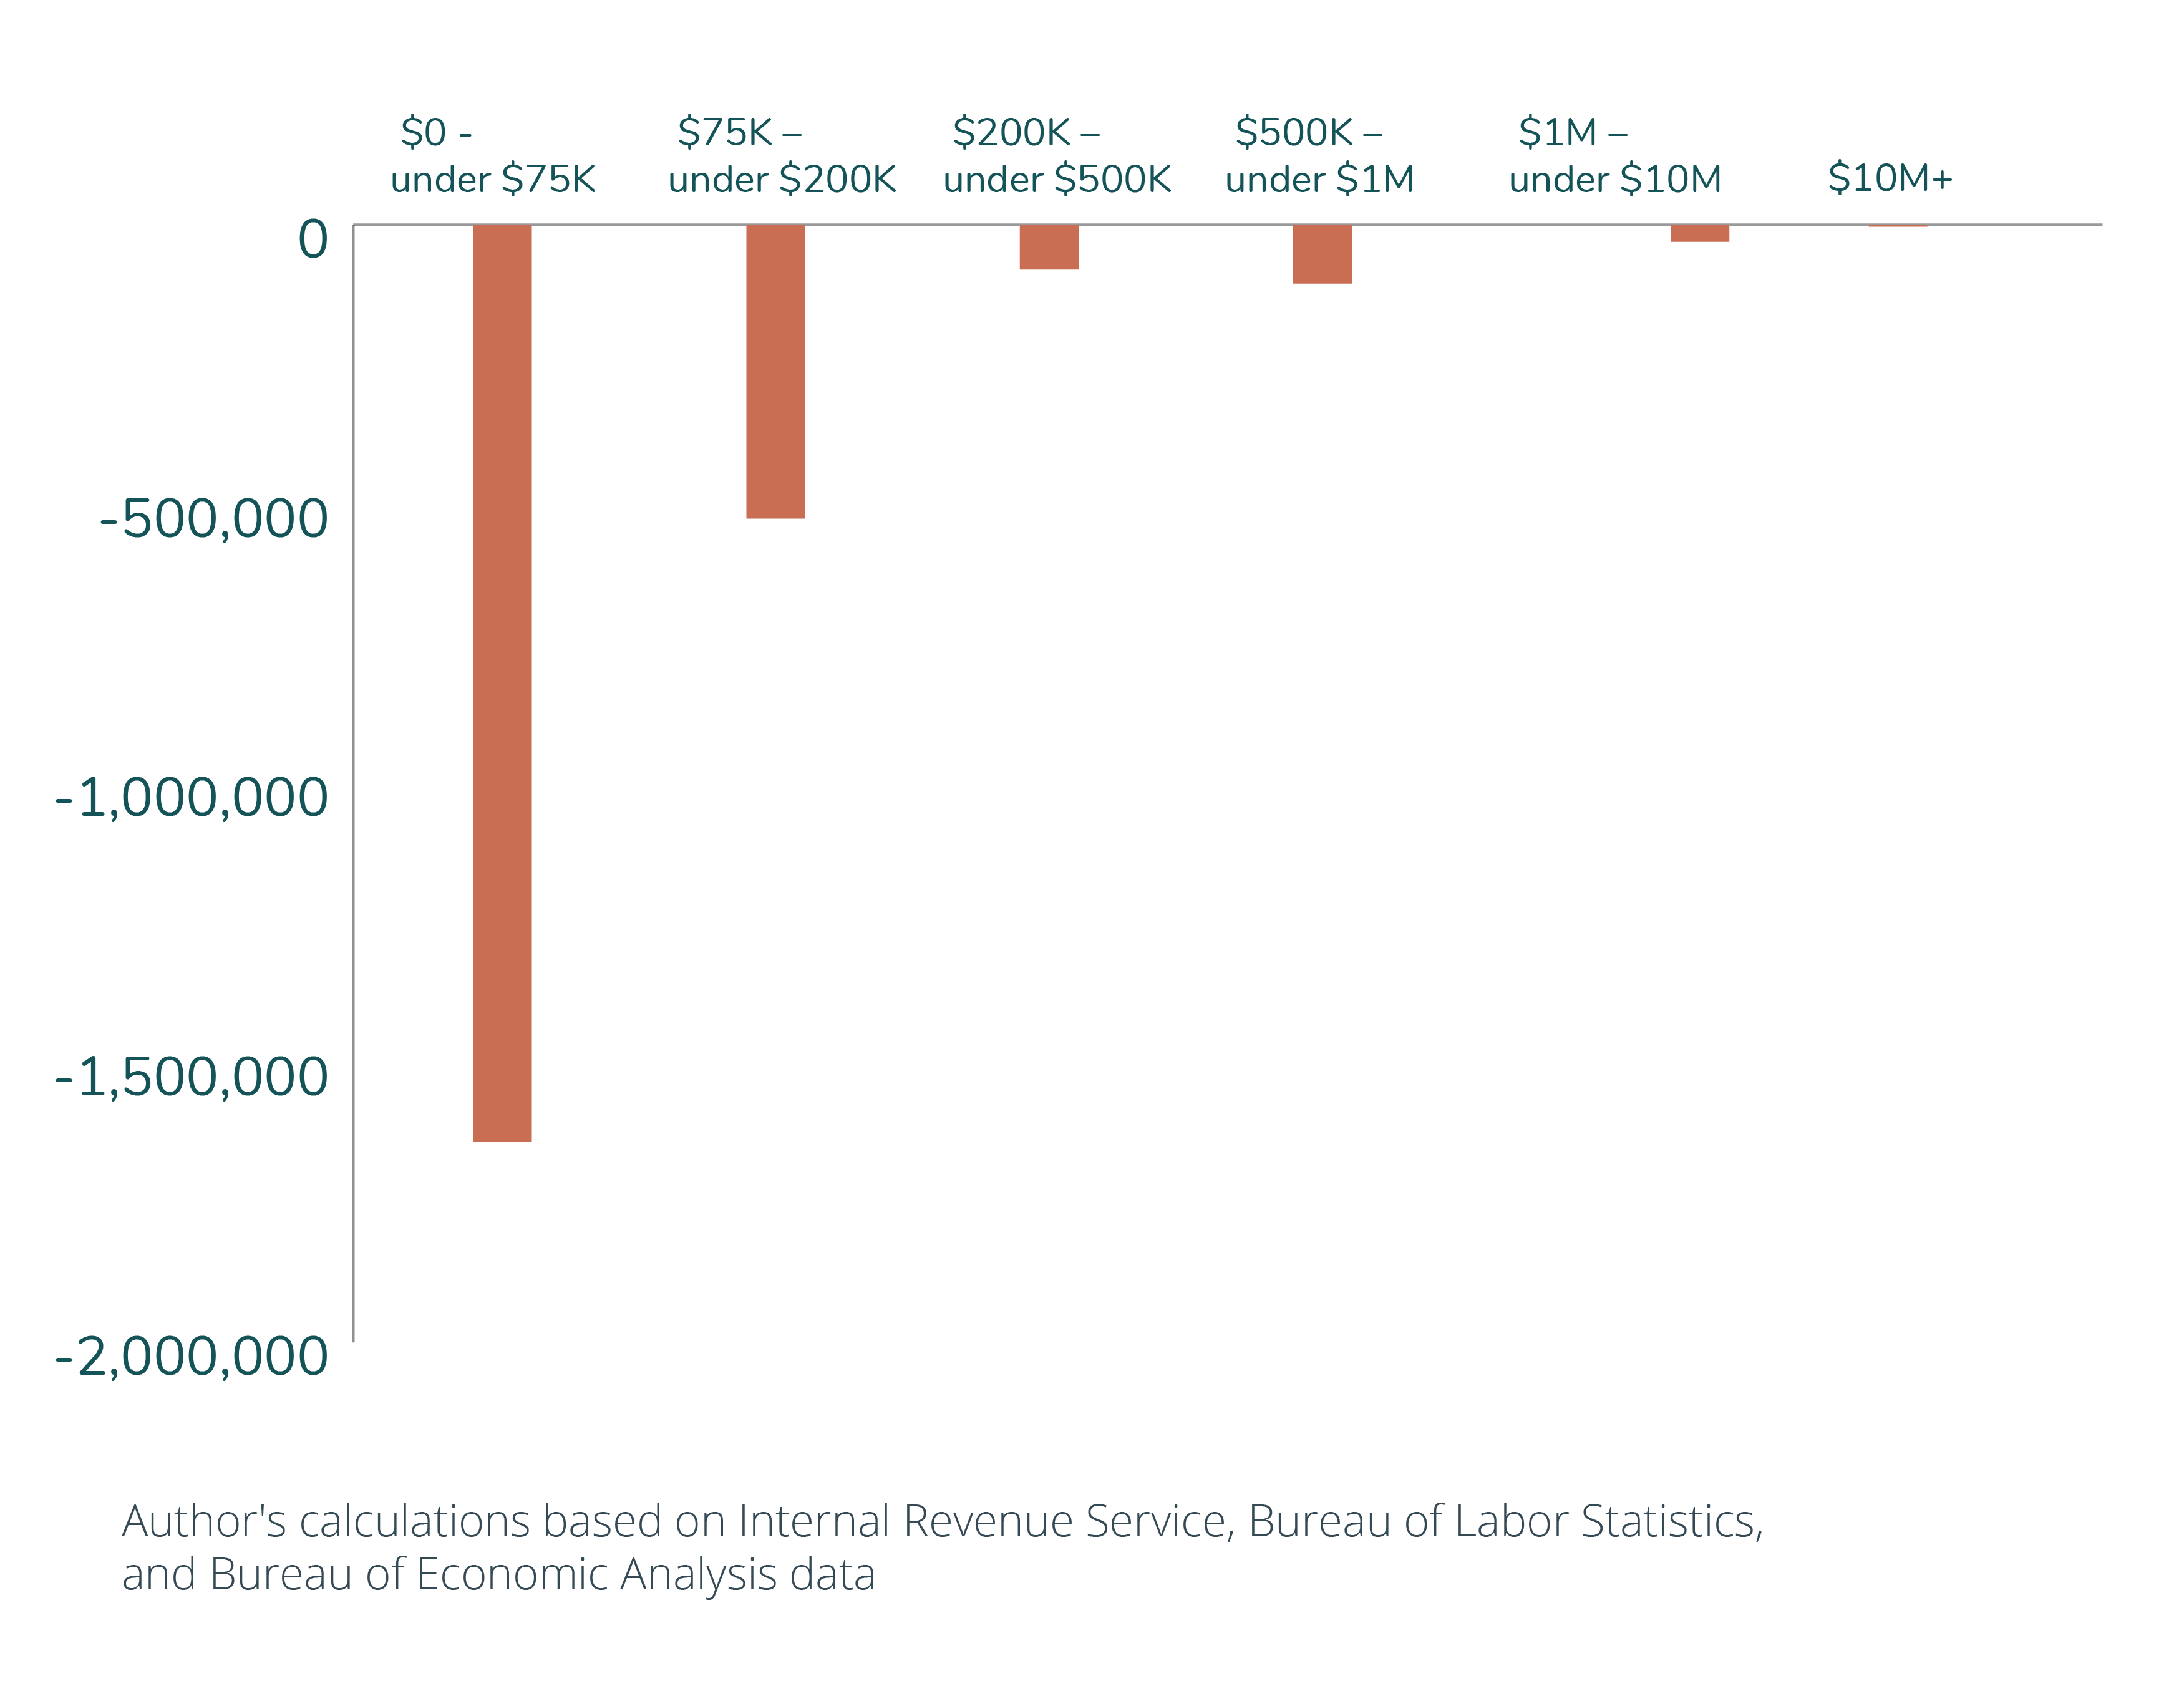
While the effects on income disproportionately affect higher-income Ohioans, effects on labor supply are most greatly concentrated on lower-income households.
The decrease in labor supply is concentrated mostly among Ohioans making less than $75,000.
The decline in wages reduces the relative price of non-market activities.
Even though high-income and high-wealth individuals reduce their time at work, some workers – the younger, less wealthy – increase their labor supply in an effort to accumulate savings and smooth consumption across stages of life. These individuals work more for less in order to save sufficiently for retirement – suggesting that everyone is made worse off by the policy change.
For those workers, labor supply – measured in hours worked – peaks by age 44 before declining again. This implies younger workers will see a larger decrease in welfare than older individuals who have already accumulated more assets. The biggest losers are younger high-income workers with little or no assets. The groups to see the smallest decline in welfare are low- and middle-income retirees who no longer rely on employment income.
Although the draft legislation may be modified before it is adopted, this analysis provides estimates of the economic and distributional impact of the parts of tax proposals – individual income, pass-through and corporate taxes – that will directly affect household budgets and their economic decisions.